reporting.io
Shopify x Google Analytics 1-Pager Dashboard
Shopify x Google Analytics 1-Pager Dashboard
Monthly Recurring
Couldn't load pickup availability
Automate your Shopify x Google Analytics reporting and get a real-time view on performance with our Shopify x Google Analytics 1-Pager Dashboard (click to view a free live demo).
This automated dashboard will provide you and your team with a top-line view across all key metrics, including:
- Impressions
- Clicks
- Cost
- CPC
- Transactions
- Conversion Rate
- SOV
- Revenue
- ROAS
- CPA
- New Users
Across Channels, Campaigns, Ad Groups and Keywords, for your selected date range, simply select the date range you want to analyse in the top right-hand side of the report.
Your data will be available at any time, from anywhere in the world, at a click of a button (or tap, from your mobile or tablet device).
Perfect for:
- Checking your daily performance across KPI
- Weekly performance updates
- Monthly reporting
Never create another boring report again with our Shopify x Google Analytics 1-Pager Dashboard.
All key metrics and data points are displayed on an easy-to-read 1-page dashboard that can be viewed online or downloaded as a PDF and sent as an email to anyone, at any time.
Our reports and dashboards have been expertly designed and curated for busy digital marketers that need results, fast.
With just a glance, your automatically updated dashboard will provide you with an easy-to-view (and understand) analysis of your business’s performance, trajectory and potential opportunities, enabling you to make quick, informed, data-driven decisions in a matter of seconds.
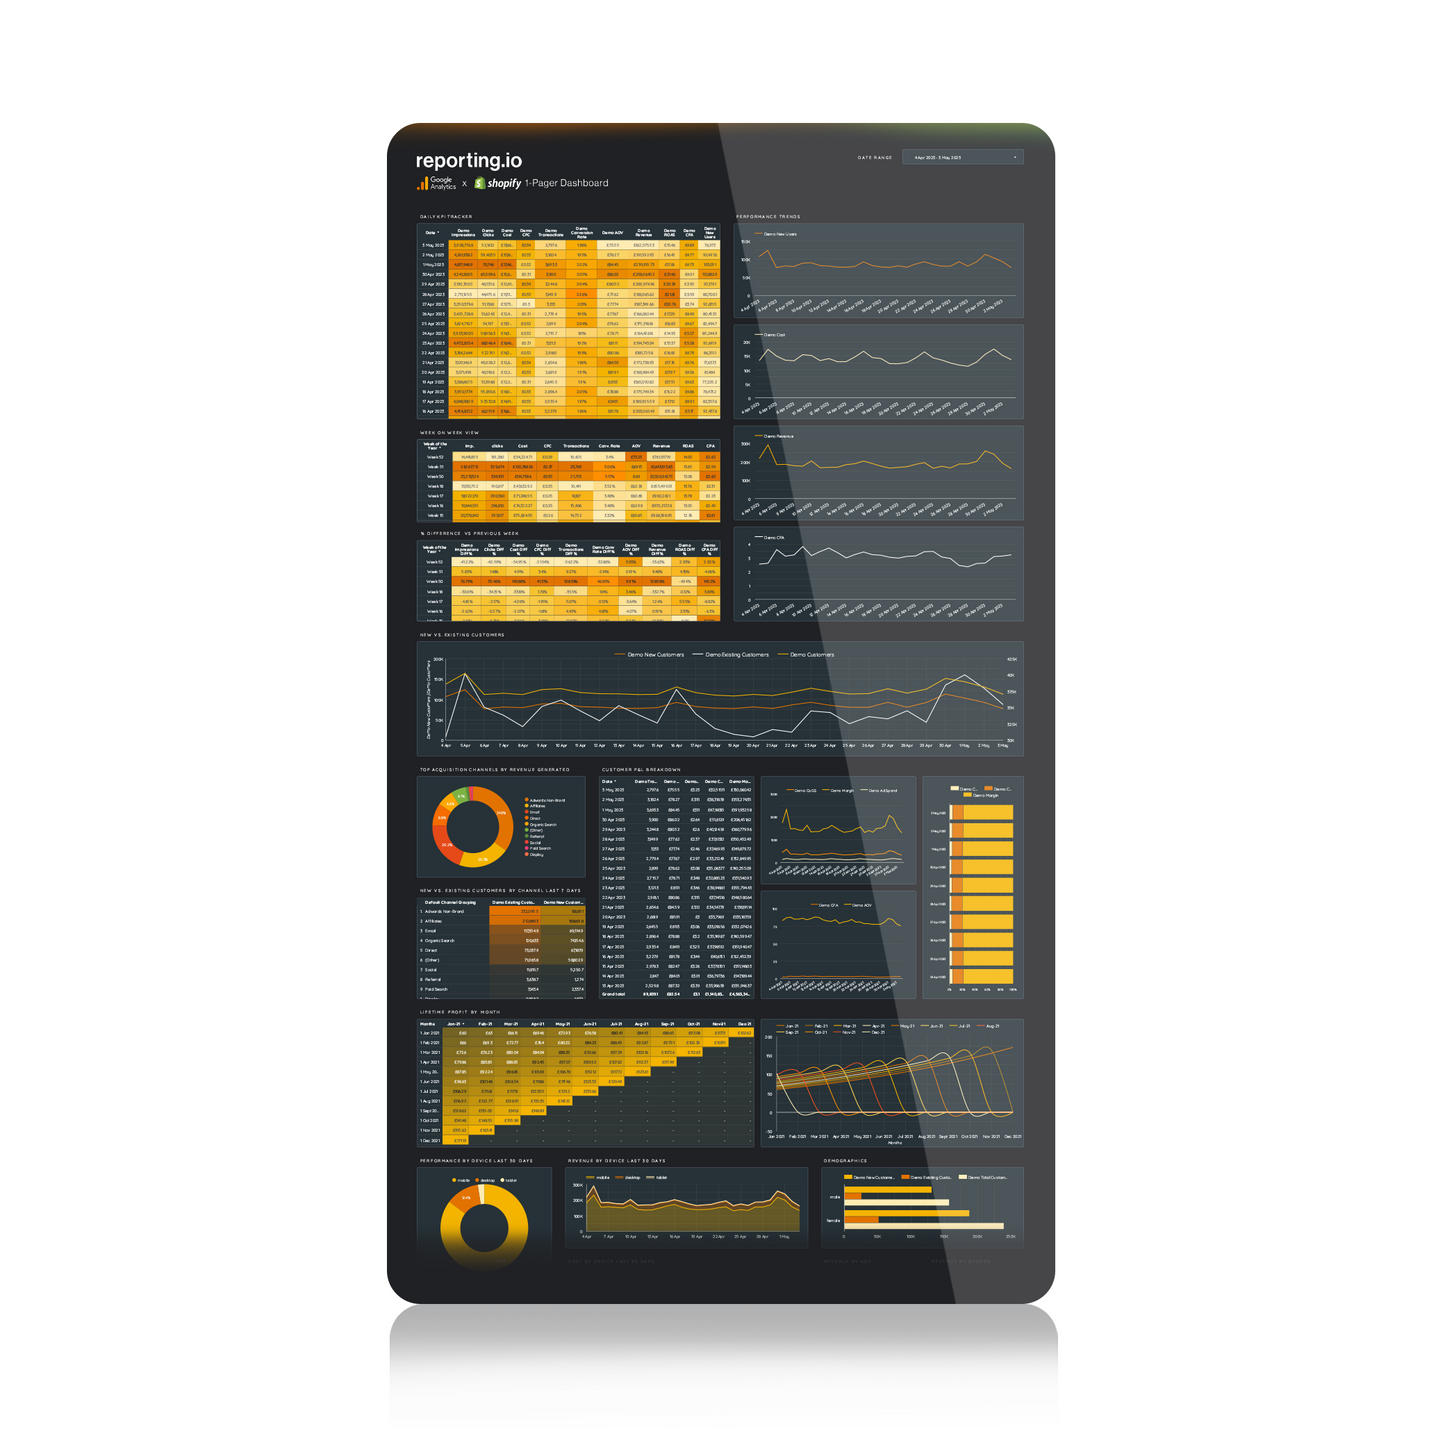
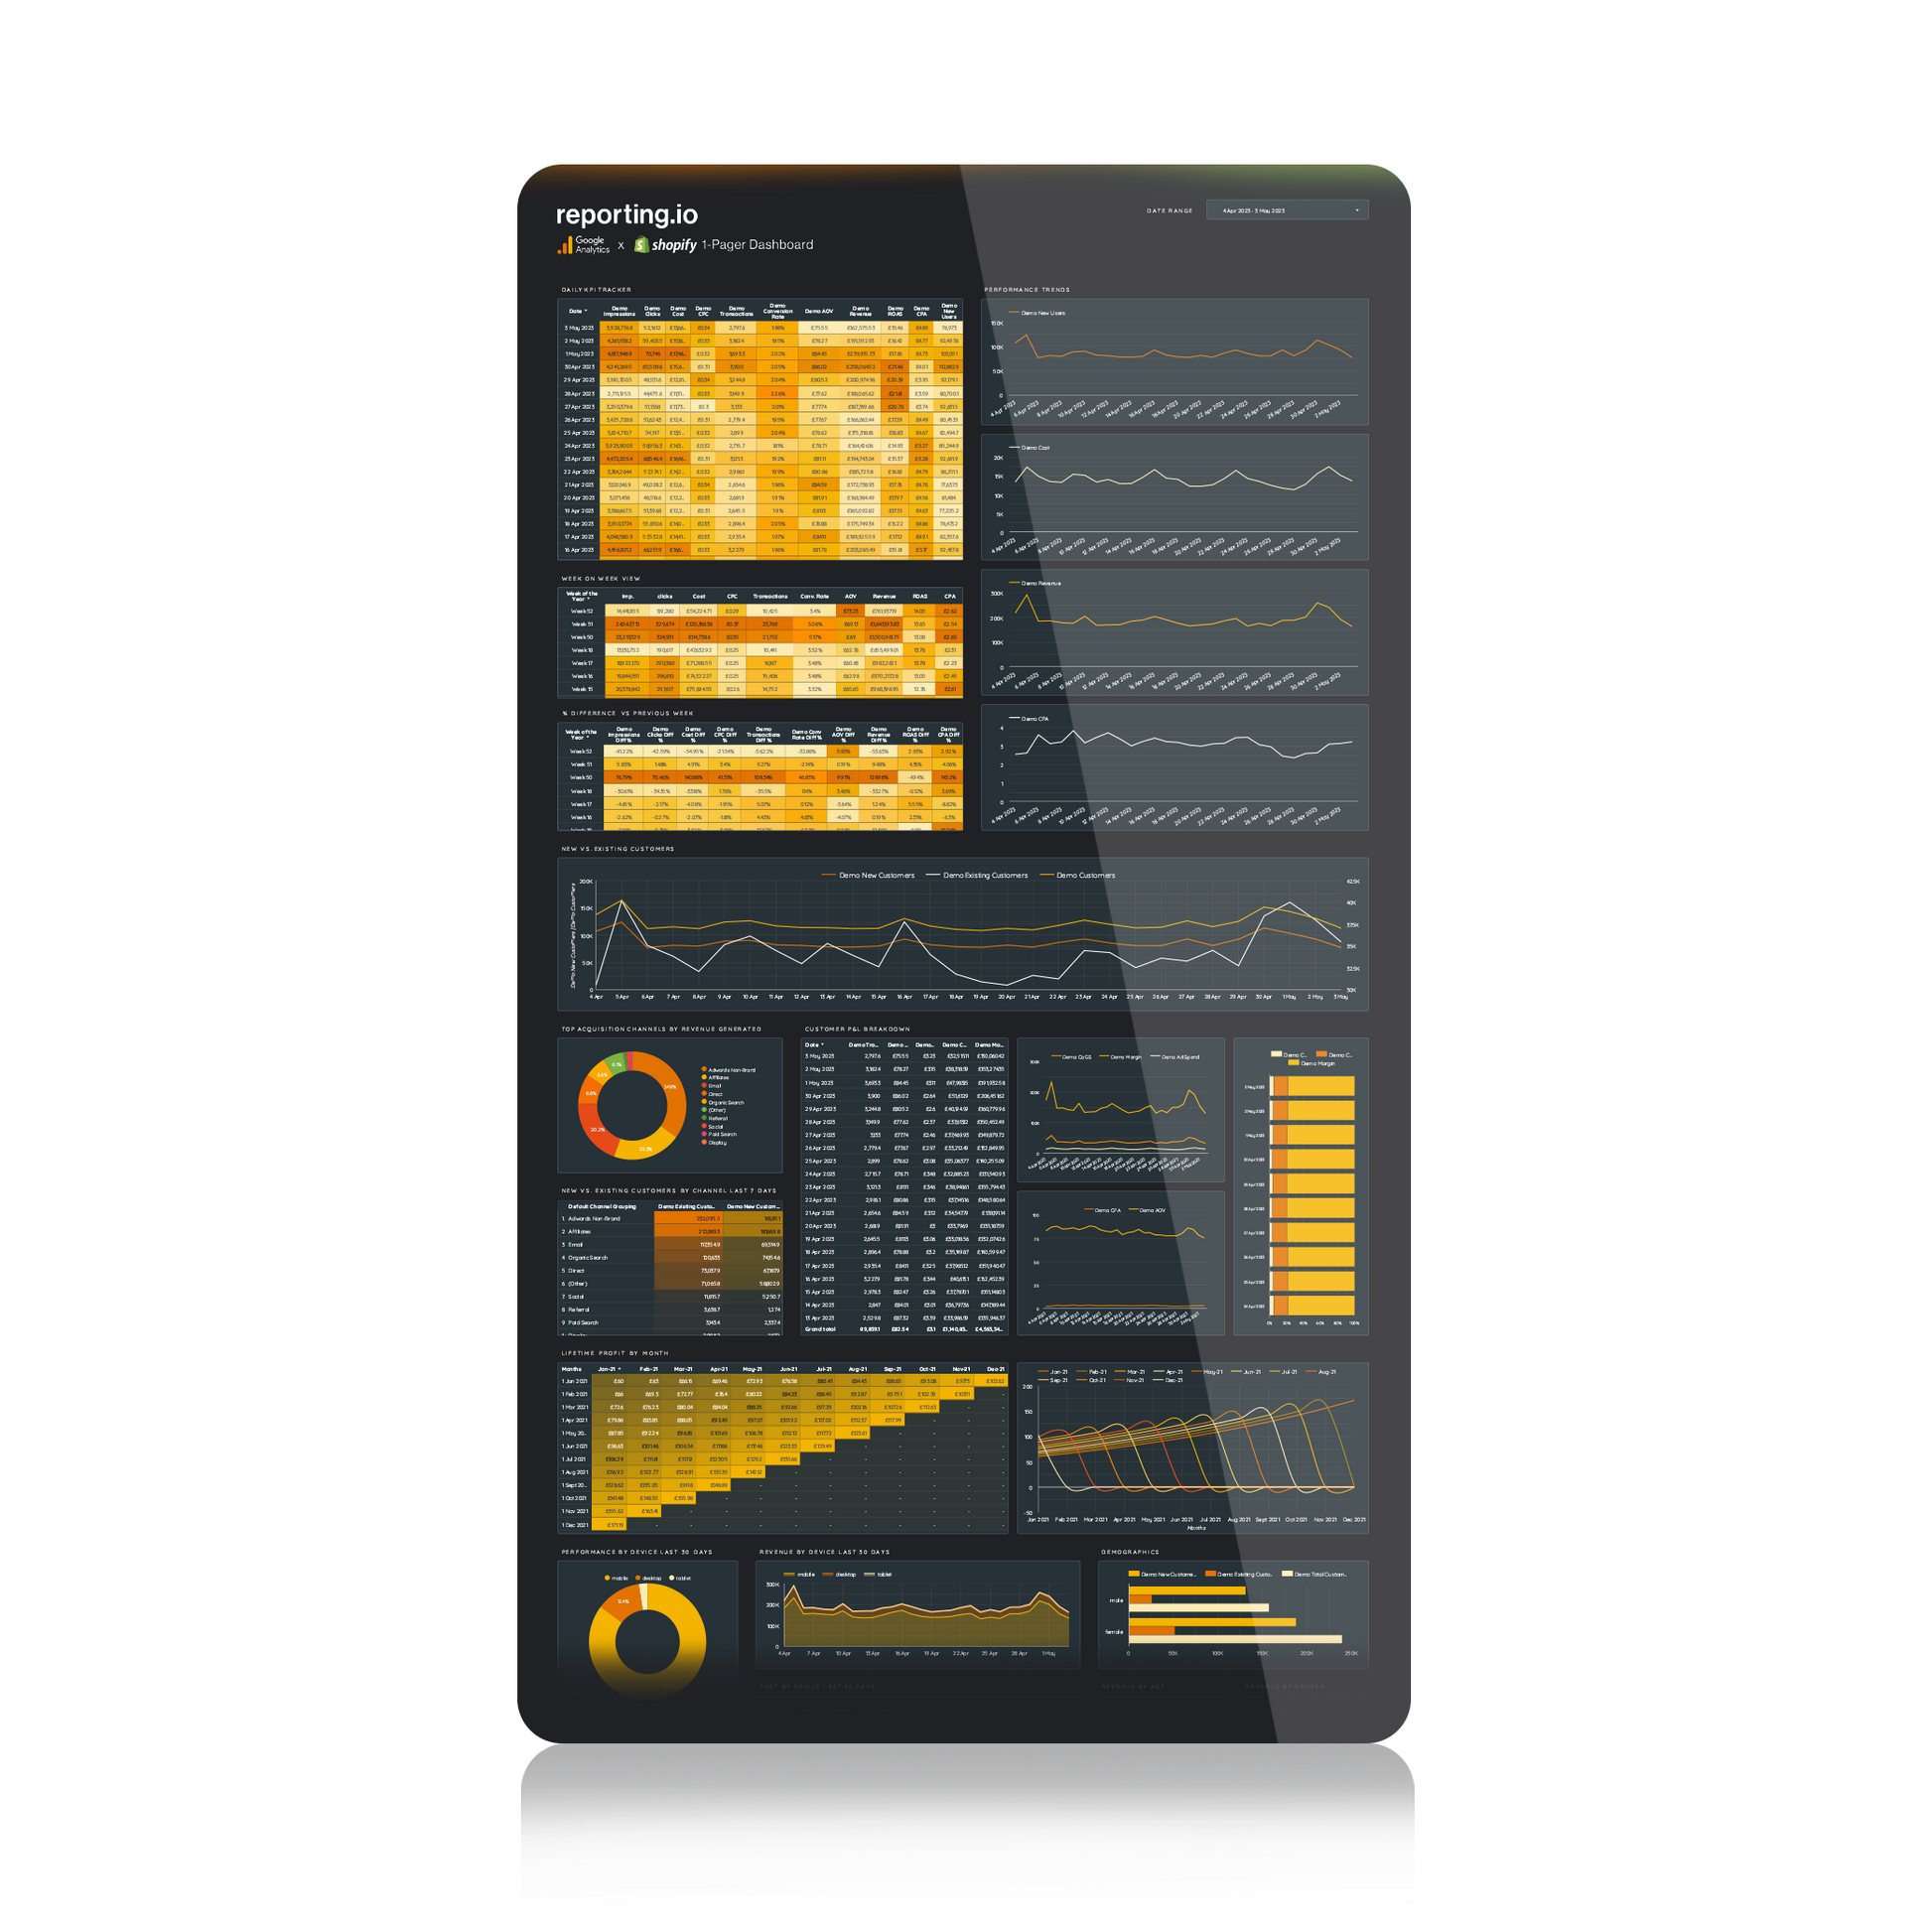
Data sets included in dashboard:
- Daily KPI Tracker: Impressions, Clicks, Cost, CPC, Transactions, Conversion Rate, AOV, Revenue, ROAS, CPA, New Users
- Week on Week View: Impressions, Clicks, Cost, CPC, Transactions, Conversion Rate, AOV, Revenue, ROAS, CPA
- % Difference vs Previous Week: Impressions, Clicks, Cost, CPC, Transactions, Conversion Rate, AOV, Revenue, ROAS, CPA
- Performance Trends: New Users, Cost, Revenue, CPA
- New vs Existing Customers
- Top Acquisition Channels by Revenue Generated
- New vs Existing Customers by Channel: Last 7 days
- Customer P&L Breakdown: Cost vs Margin vs Ad Spend, CPA vs AOV
- Lifetime Profit by Month
- Performance by Device last 30 Days
- Revenue by Device last 30 Days
- Cost by Device last 30 Days
- Demographics
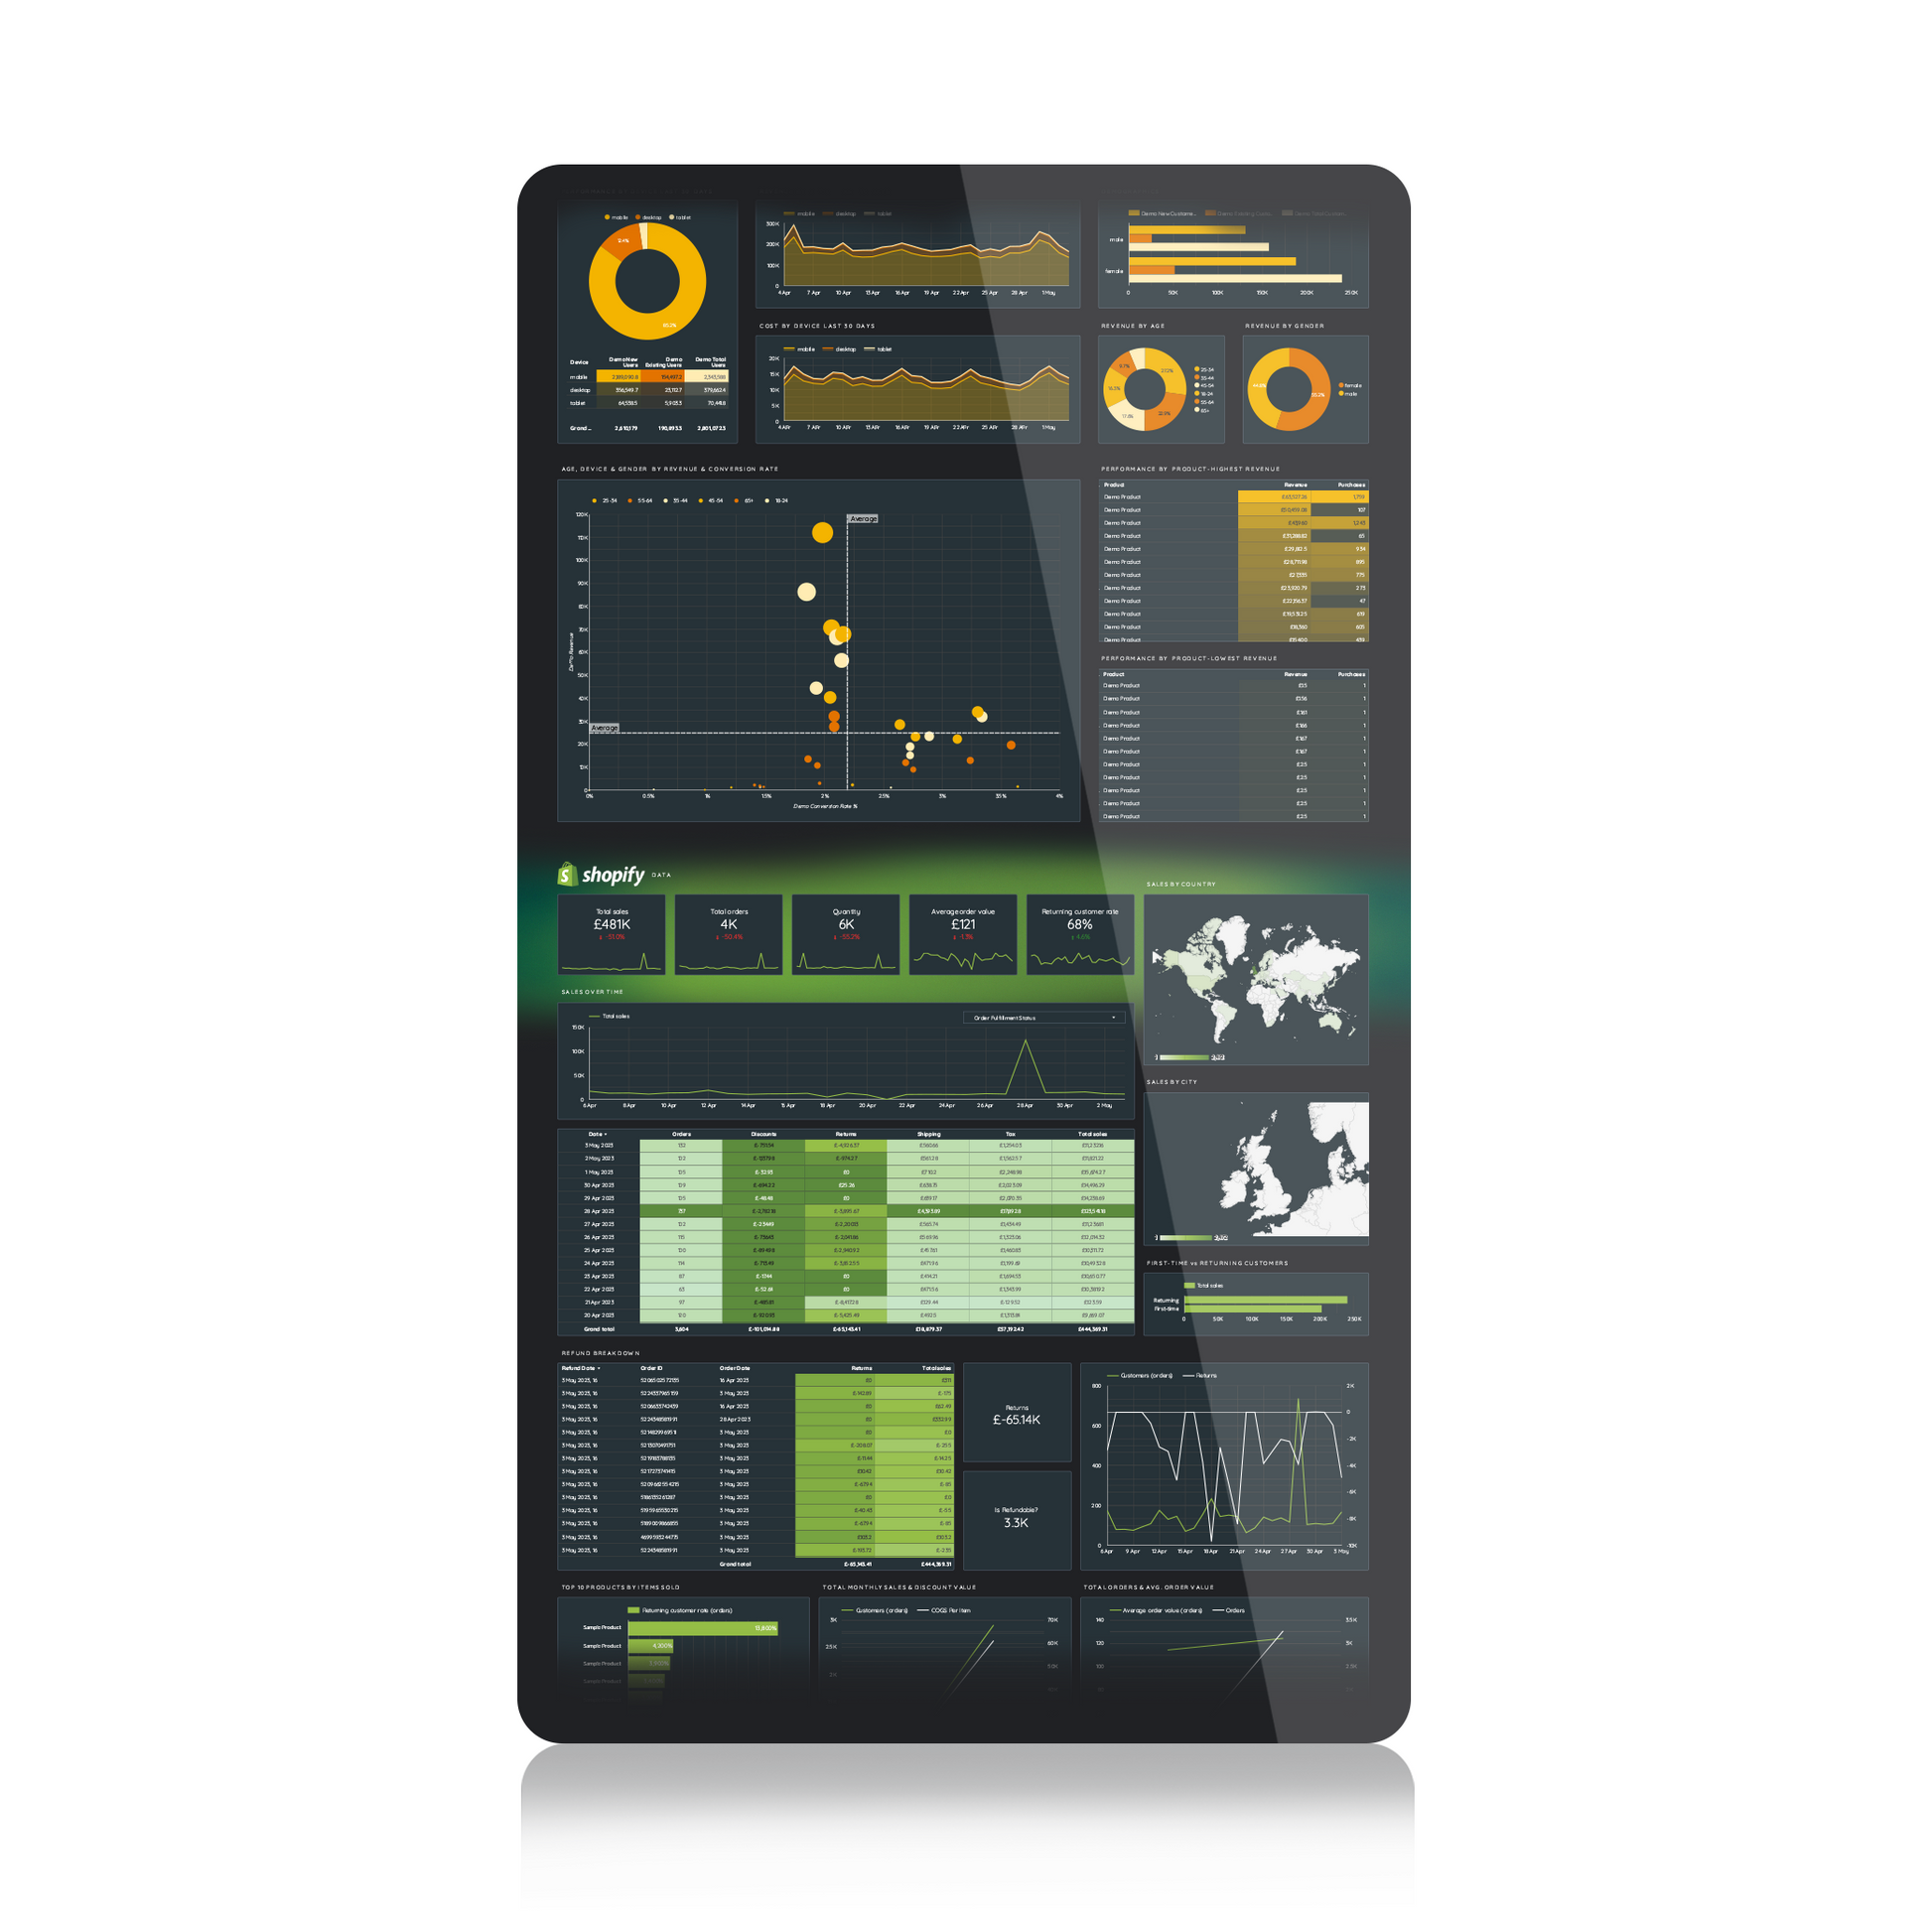
- Revenue by age and gender
- Performance by Product- Highest Revenue vs Lowest Revenue
- Shopify Total Sales, Orders, Quantity, AOV, Returning Customer Rate
- Sales By Country, City
- Sales Over Time
- Refund Breakdown
- Top 10 Products By Items Sold
- Total Monthly Sales Discount Value
- Total Orders & Avg. Order Value
View a live demo of this dashboard here for free.
Upon purchase, you will receive:
- A signed NDA and copy of your order receipt
- An e-mail requesting access to all required data sources
- Secure login details and a link to the report within 24 hours once data access has been provided
- An instruction video explaining how to use and read the report